
As finance teams shift from transactional to strategic roles, the way we measure accounts payable performance is also evolving rapidly.
Accounts Payable (AP) is no longer a back-office function—it’s a strategic lever for improving cash flow, supplier relationships, and financial agility. In 2025, as automation, AI, and real-time analytics reshape finance operations, the metrics that matter most in AP are evolving.
CFOs and AP leaders are moving beyond basic cost-per-invoice calculations to focus on deeper insights that reflect process maturity and digital transformation. This blog explores the key AP metrics that matter in 2025, why they’re important, and how leading companies are using them to drive results.
1. Touchless Invoice Rate
What It Measures:
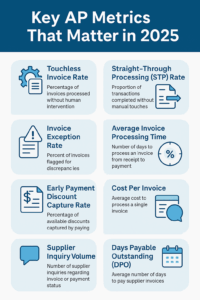
The percentage of invoices processed from receipt to payment without any human intervention.
Why It Matters in 2025:
Touchless processing is the hallmark of a mature AP automation setup. High-performing AP teams are aiming for 80%+ touchless rates to reduce errors, speed up cycle times, and cut costs.
Real-World Insight:
A U.S.-based manufacturing firm using AI-powered invoice automation reported a 72% touchless invoice rate, leading to 40% faster approvals and a 25% drop in late payments.
2. Straight-Through Processing (STP) Rate
What It Measures:
The proportion of transactions that go through the entire process—receipt, matching, approval, and payment—without manual touches.
Why It Matters in 2025:
STP reduces bottlenecks and frees up your AP team to handle exceptions rather than routine work.
Industry Benchmark:
Top-quartile companies report STP rates above 75%, compared to less than 30% in low-performing organizations.
3. Invoice Exception Rate
What It Measures:
The percentage of invoices flagged for discrepancies like missing POs, incorrect amounts, or duplicate entries.
Why It Matters in 2025:
High exception rates are red flags for upstream issues in procurement or supplier onboarding. Automation in 2025 includes intelligent matching and validation layers to reduce exceptions.
Pro Tip:
Target an exception rate below 10% for healthy AP workflows.
4. Average Invoice Processing Time (Invoice Cycle Time)
What It Measures:
The number of days it takes to process an invoice from receipt to payment.
Why It Matters in 2025:
With dynamic discounting and real-time analytics, faster invoice turnaround means more opportunities for early-payment discounts and fewer late fees.
Benchmark:
Top-performing companies are processing invoices in 5 days or less with full automation.
5. Early Payment Discount Capture Rate
What It Measures:
The percentage of available early payment discounts that are actually captured.
Why It Matters in 2025:
As interest rates stay volatile, capturing early payment discounts is an easy win for cost savings—if your process is fast and predictable enough.
Best Practice:
Integrate dynamic discounting logic into your AP platform to automatically optimize payment timing.
6. Cost Per Invoice
What It Measures:
The total cost (labor, systems, overhead) to process a single invoice.
Why It Still Matters:
While more AP teams are focused on strategic metrics in 2025, cost-per-invoice remains a fundamental benchmark for operational efficiency.
Industry Benchmark:
Manual processes cost $10–15 per invoice; best-in-class automation can bring this down to $1–3.
7. Supplier Inquiry Volume
What It Measures:
The number of supplier emails or calls asking about invoice or payment status.
Why It Matters in 2025:
A spike in inquiries often signals poor communication or lack of transparency. Self-service portals and automated notifications can reduce friction.
What to Watch:
Aim for a drop of 40–60% in supplier inquiries post-automation.
8. Days Payable Outstanding (DPO)
What It Measures:
The average number of days a company takes to pay its suppliers.
Why It Matters in 2025:
DPO is a key working capital metric, and automation gives AP leaders more control over payment timing to align with cash flow strategies.
Balance Is Key:
Too high a DPO could hurt supplier relationships; too low, and you may lose liquidity advantages.
In 2025, modern AP teams are not just tracking data—they’re using it to drive action. With intelligent automation platforms, real-time dashboards, and embedded analytics, finance leaders can monitor what matters and make smarter decisions faster.
Focusing on the right AP metrics helps you:
Uncover process bottlenecks
Improve supplier relationships
Strengthen cash flow
Justify the ROI of AP automation investments
If your organization still measures AP success solely by cost savings, it’s time to broaden the lens. The future of accounts payable is strategic—and the metrics must reflect that.