In 2017, Kobe Steel — one of Japan’s largest metal producers — admitted to falsifying inspection and mill test data for aluminum, copper, and some steel products shipped to customers worldwide. The falsification affected thousands of batches destined for sectors as critical as aerospace, automotive, and infrastructure. In some cases, mechanical properties such as tensile strength were altered on paper to meet standards, even when the actual material fell short. The scandal resulted in a massive loss of trust, costly recalls, and heightened scrutiny of quality control processes across the metals industry. (Source: https://www.reprisk.com/insights/case-studies/kobelco# )
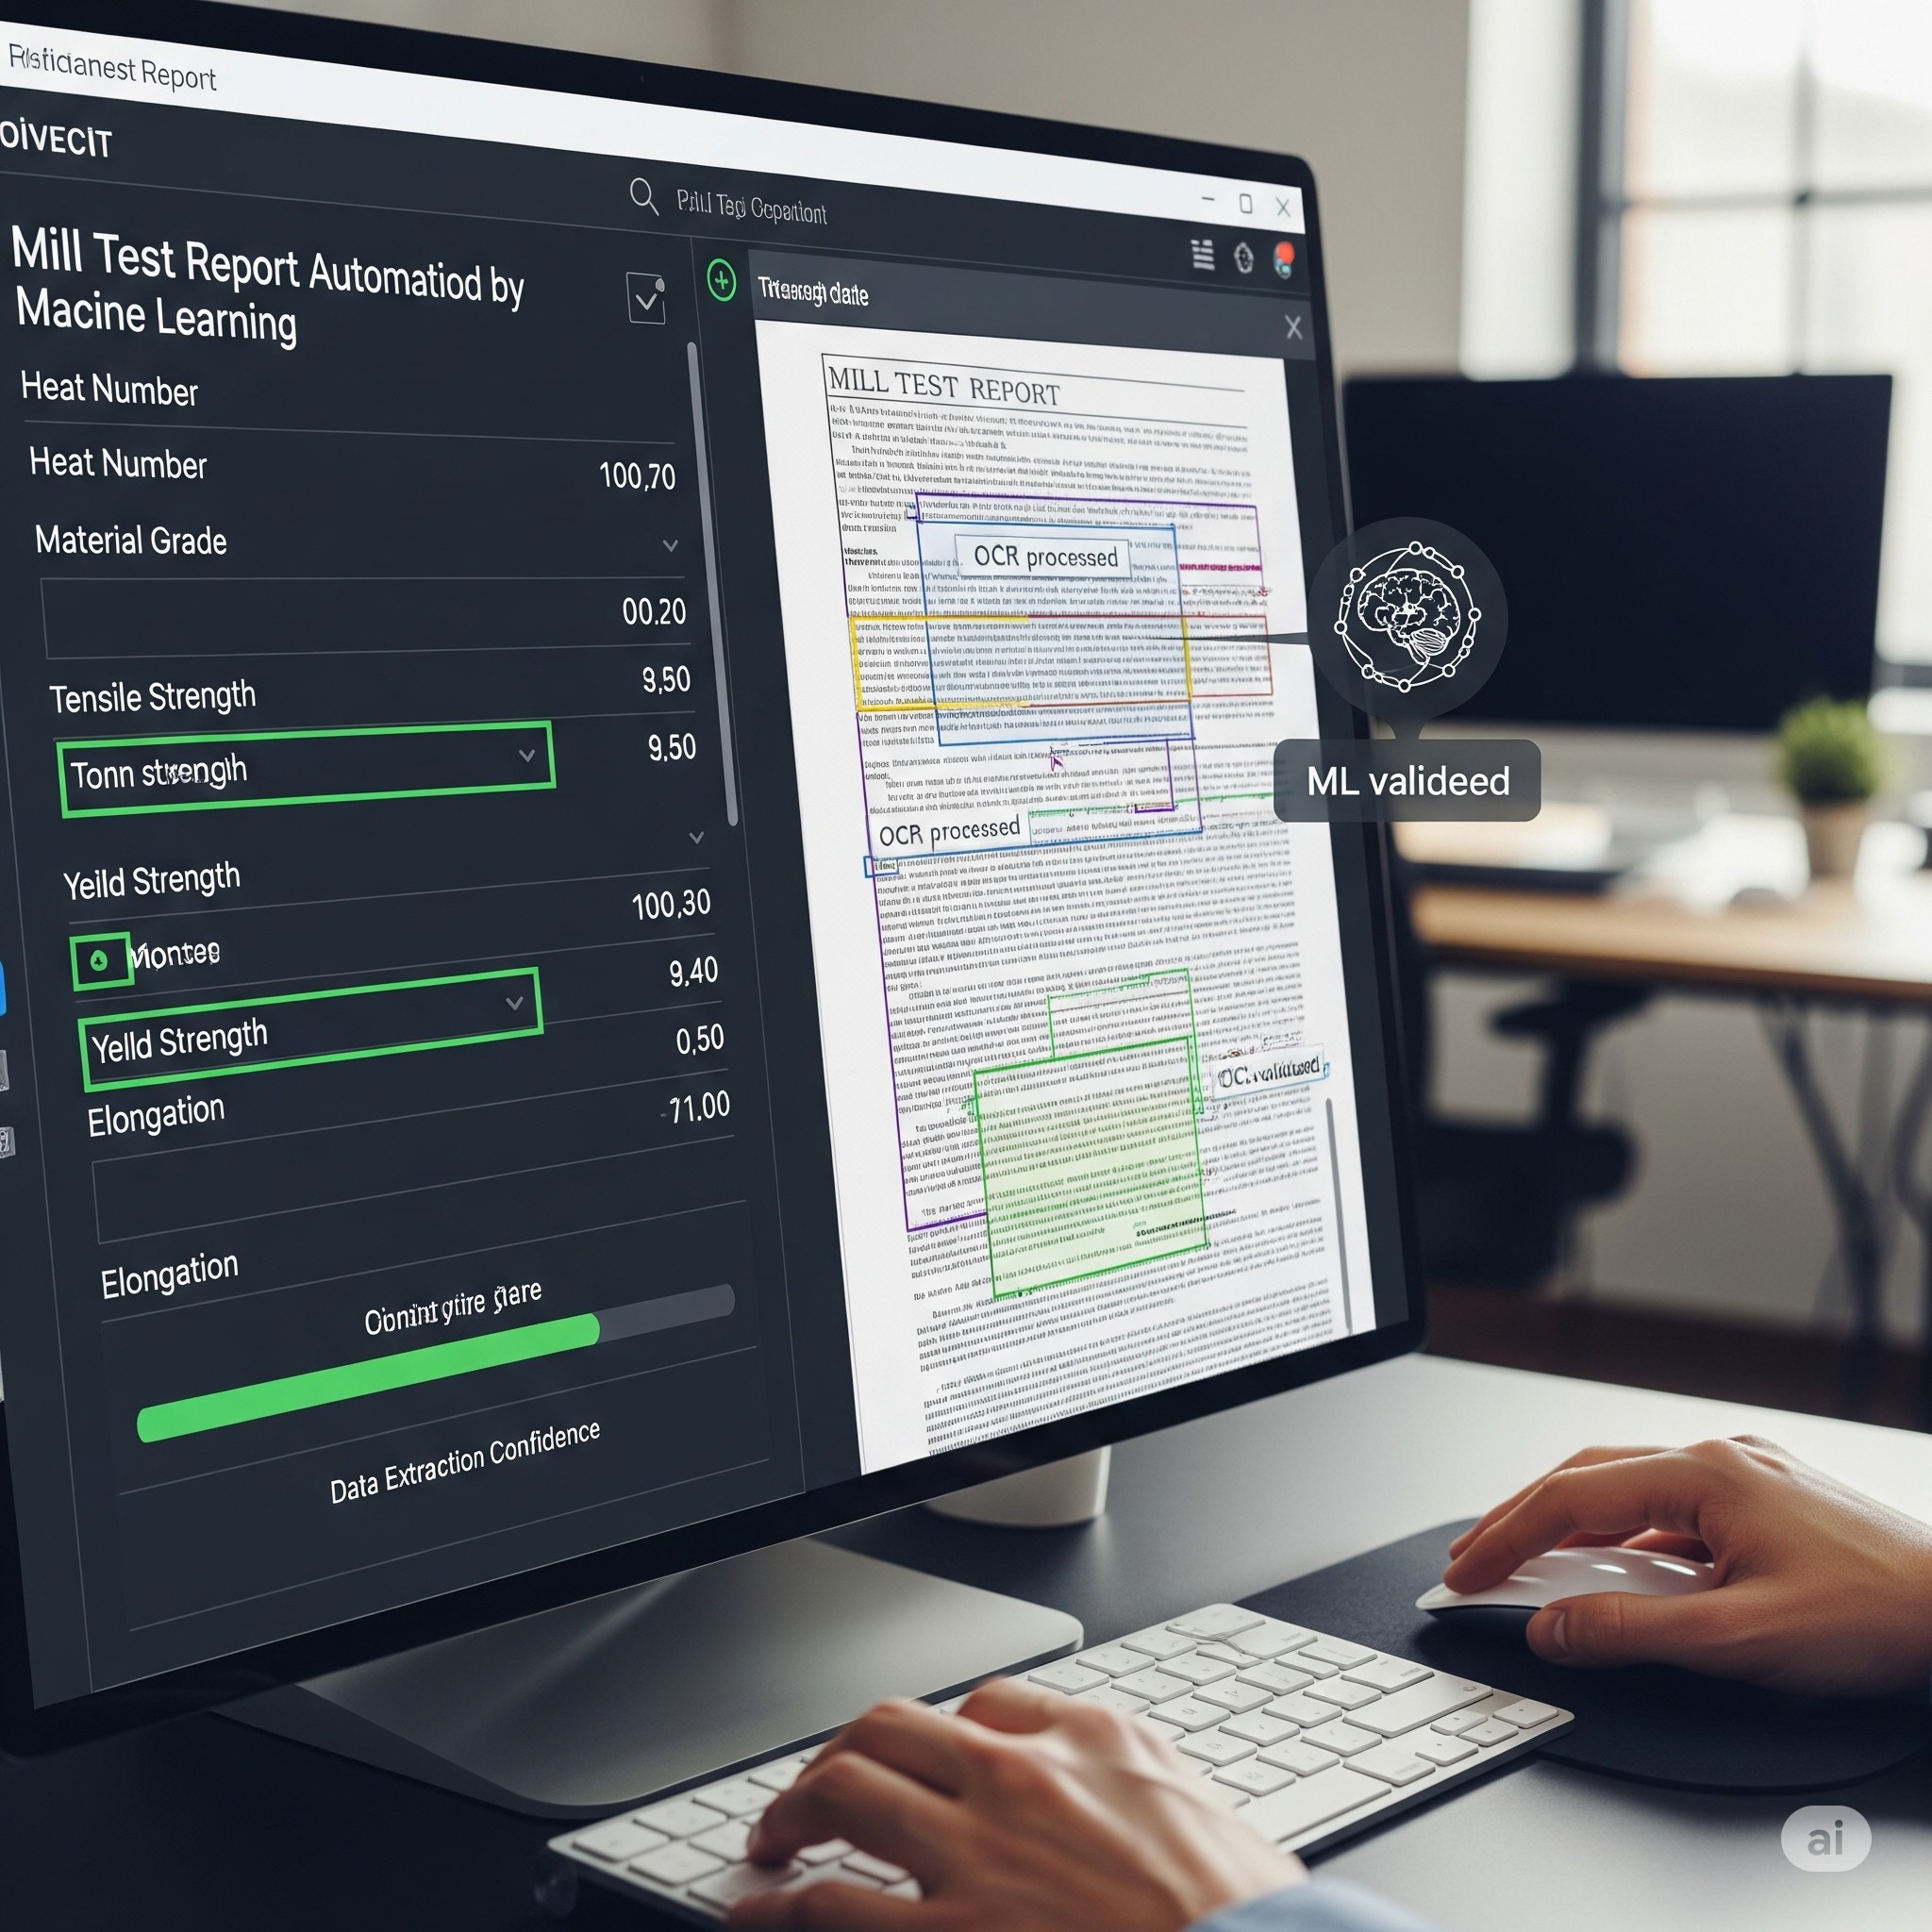
Incidents like this highlight why compliance in the metals sector is non-negotiable. Whether it’s meeting ASTM standards, maintaining precise chemical composition tolerances, or aligning with industry-specific safety regulations, Mill Test Reports (MTRs) serve as the official record of material quality and conformity. Yet with thousands of MTRs generated monthly, manual reviews can overlook subtle deviations — and that’s where machine learning (ML) models are transforming compliance risk detection.
Why Compliance Risks Hide in MTRs
MTRs capture data on heat numbers, chemical composition, mechanical properties, supplier details, and production batches. But risks can remain undetected due to:
High Data Volume & Variability – Different suppliers use different formats and terminology.
Complex Tolerance Rules – Acceptable ranges vary by grade, end-use, and jurisdiction.
Human Oversight Limits – Even expert QC staff can miss subtle statistical anomalies in large datasets.
How Machine Learning Predicts Compliance Risks
Instead of relying solely on fixed rule-based checks, ML models learn patterns from historical MTRs to detect both blatant violations and hidden anomalies. Here’s how it works:
1. Anomaly Detection Models
Purpose: Identify MTRs with unusual property patterns, even if they meet the official tolerance limits.
Common Algorithms:
Isolation Forest – Efficiently identifies data points that are “isolated” from the rest.
One-Class SVM – Learns the boundary of normal compliance patterns and flags anything outside it.
Example:
In the Kobe Steel scenario, anomaly detection could have flagged multiple certificates showing mechanical property values exactly at the minimum passing threshold, an unlikely pattern in genuine production data.
Flow Diagram:
Historical MTR Dataset → Learn “Normal Patterns” → New MTR → Risk Score → Flag for Review
2. Classification Models
Purpose: Predict whether a batch will be compliant or non-compliant based on labeled historical data.
Common Algorithms:
Random Forest – Handles noisy MTR data well and provides feature importance metrics.
XGBoost – Highly accurate with structured tabular data, like standardized MTRs.
Example:
A manufacturer labels 5 years of MTRs as “pass” or “fail” based on QC results. The classification model learns that low elongation combined with slightly high sulfur content is a high-risk combination, even if each value independently passes.
Flow Diagram:
Labeled MTRs (Pass / Fail) → Train Model → New MTR → Compliance Prediction → QC Decision
3. Regression Models
Purpose: Estimate the probability or severity of non-compliance rather than just yes/no outcomes.
Common Algorithms:
Linear Regression – Good for simpler property-risk relationships.
Gradient Boosted Regression Trees – Capture non-linear effects.
Example:
A copper wire producer uses regression to predict the probability of tensile test failure based on trace elements like oxygen and phosphorus. A batch scoring 0.82 failure probability is automatically sent for retesting.
Flow Diagram:
MTR Properties → Regression Model → Probability Score → Action Thresholds (>0.7 = Retest)
4. Neural Networks (Deep Learning)
Purpose: Capture complex multi-dimensional relationships in MTR data that simpler models might miss.
Common Architectures:
Fully Connected Dense Networks – For structured, tabular MTR data.
Autoencoders – Learn normal MTR patterns and flag deviations via reconstruction errors.
Example:
In aerospace aluminum production, a neural network could learn that a specific combination of alloy composition, heat treatment, and supplier process variance predicts fracture risk in extreme cold — something too subtle for manual detection.
Flow Diagram:
MTR Features → Input Layer → Hidden Layers (Pattern Learning) → Output Layer (Risk Category / Probability)
The Integrated ML Pipeline for MTR Compliance
In practice, leading manufacturers use a multi-step hybrid approach:
Anomaly Detection screens for suspicious batches.
Classification Models assign compliance categories.
Regression Models calculate severity scores.
Neural Networks catch complex risks missed by other models.
Pipeline Overview:
Benefits Beyond Compliance
Early Risk Detection – Spot deviations before they cause downstream failures.
Supplier Insights – Identify vendors with recurring quality drifts.
Efficiency – Free QC teams from manual, repetitive checks.
Cost Savings – Avoid rework, penalties, and recall expenses.
The Kobe Steel case made it clear: even global market leaders can suffer massive reputational and financial losses when MTRs are unreliable. Machine learning doesn’t just automate compliance checks — it turns MTRs into a predictive quality assurance system.
In a sector where a single unnoticed deviation can cost millions or even endanger lives, proactive, ML-driven MTR analysis is not just a competitive advantage — it’s becoming a necessity.